
The question
Through which residues is an interface between two proteins built, and how does that information become a deliverable file?
Example study
Demonstration on a publicly available structure
The work below is not a customer project. To show how the team’s steps look on real data, we used a publicly available, experimentally solved protein–protein complex.
Through which residues is an interface between two proteins built, and how does that information become a deliverable file?
RCSB PDB 1BRS, biological assembly 1, model 1. Barnase (chain A) and barstar (chain D). The file identity and its SHA-256 are kept in the asset register.
The chains were separated by the label_asym_id field; minimum heavy-atom distances were scanned at a 4.5 Å cutoff. Because the crystal holds three copies of the complex, only biological assembly 1 was used.
43 residue pairs: 19 residues on the barnase side, 16 on the barstar side. The list is produced in the same interface_contacts.csv format we deliver.
The computed interface overlaps the region described for this complex in the literature: residues of the barnase active site (Lys27, Arg59, Arg83, Arg87, His102) appear among the shortest contacts in the list. In other words, the method independently finds a known interface.
This is not a design output: barstar is not a designed candidate but the natural inhibitor of barnase. Nor is the contact list an affinity measurement; it records a geometric fact about the structure. In a design project the same analysis runs on candidate models we generate, and the results are reported as predictions.
Source publicationBuckle AM, Schreiber G, Fersht AR. Biochemistry. 1994;33(30):8878–89.RCSB PDB 1BRS
3D demonstration
This is not a candidate designed by the team. It is a demonstration, on a publicly available and experimentally solved protein–protein complex, of how the workflow steps look.
SourceRCSB PDB 1BRSBuckle AM, Schreiber G, Fersht AR. Biochemistry. 1994;33(30):8878–89.
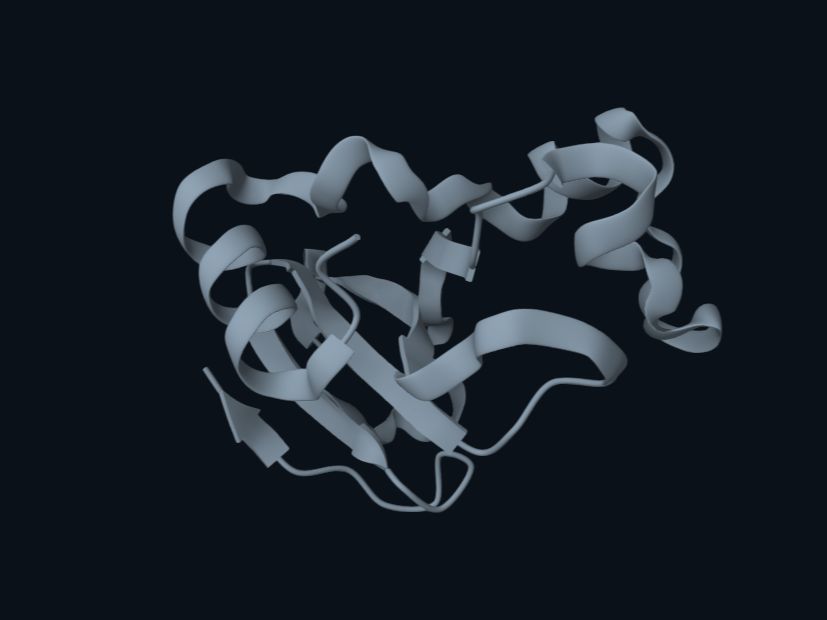
Nothing 3D is downloaded until you press start. The structure file is 390 KB; the viewer library loads separately.
Step 1/5
Rotate with the mouse or a finger; zoom with the wheel or two fingers. The steps can also be moved through with the keyboard.
Your browser does not support 3D rendering, or the file failed to load. The step descriptions and the contact map below carry the same information.
A contact was counted where the minimum heavy-atom distance is 4.5 Å or less. Computed on this file, for model 1 and the A–D chain pair.
New to the field? Start here. The explanations are deliberately short.
The first message never asks for confidential sequences, unpublished structures or sensitive files. Technical detail follows an appropriate confidentiality process.